Advanced Example
A basic Workflow using SciWIn Client (s4n) can be created with the commands hereafter. This guide assumes the usage of unix based operating systems, however Windows should work, too. If not please open an issue.
Installation
Section titled “Installation”
The latest Version of s4n can be installed using the following command:
curl --proto '=https' --tlsv1.2 -LsSf https://fairagro.github.io/m4.4_sciwin_client/get_s4n.sh | shSpecific Versions can be installed with the following command, by replacing the version tag with a version of choice.
curl --proto '=https' --tlsv1.2 -LsSf https://github.com/fairagro/m4.4_sciwin_client/releases/download/v0.6.0/s4n-installer.sh | shThe Installation can be verified using s4n -V.
SciWIn Client comes with a lot of commands. In this demo the init, tool, workflow and execute commands will be showcased.
 _____        _  _    _  _____         _____  _  _               _/  ___|      (_)| |  | ||_   _|       /  __ \| |(_)             | |\ `--.   ___  _ | |  | |  | |  _ __   | /  \/| | _   ___  _ __  | |_ `--. \ / __|| || |/\| |  | | | '_ \  | |    | || | / _ \| '_ \ | __|/\__/ /| (__ | |\  /\  / _| |_| | | | | \__/\| || ||  __/| | | || |_\____/  \___||_| \/  \/  \___/|_| |_|  \____/|_||_| \___||_| |_| \__|
Client tool for Scientific Workflow Infrastructure (SciWIn)Documentation: https://fairagro.github.io/m4.4_sciwin_client/
Version: 0.8.0
Usage: s4n <COMMAND>
Commands:  init         Initializes project folder structure and repository  create       Creates a new CWL File or Workflow  list         Lists either all CWL Files or details to a given file [aliases: ls]  remove       Removes a CWL File from the workflows Directory [aliases: rm]  connect      Connects a workflow node  disconnect   Disconnects a workflow node  visualize    Visualizes a workflow  save         Saves a workflow  install      Installs a workflow as submodule [aliases: i]  uninstall    Removes an installed workflow  execute      Execution of CWL Files locally or on remote servers [aliases: ex]  annotate     Annotate CWL files  completions  Generate shell completions  help         Print this message or the help of the given subcommand(s)
Options:  -h, --help     Print help  -V, --version  Print version
Demo Repository
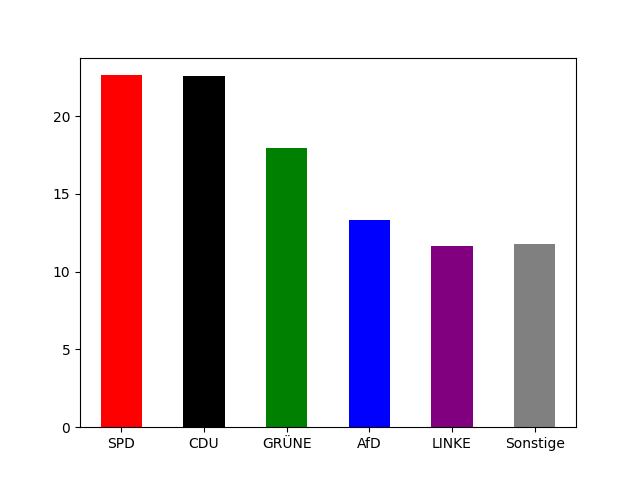
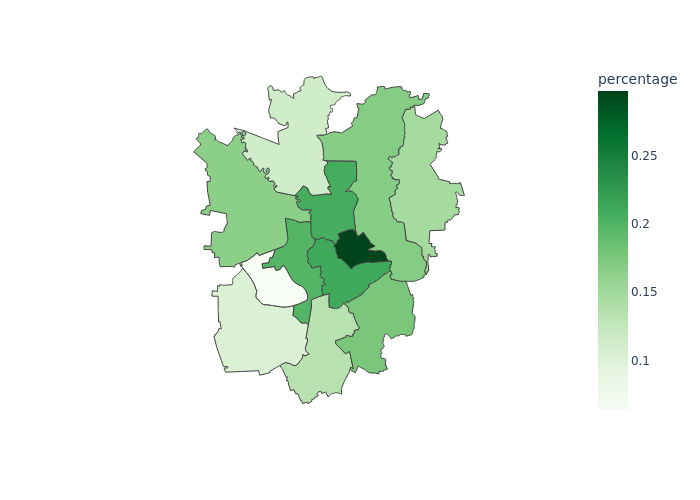
Section titled “Demo Repository”The Demo Repository mainly contains two folders data and code. The result workflow will download election data, print election results as barplot, convert input data into a geojson file, and maps it onto the geojson data resulting in a choropleth graph. See the images for the final outputs.
Creating the CommandLineTools
Section titled “Creating the CommandLineTools”First of all, we start, by creating a new s4n project.
s4n initCWL mainly describes processes in CommandLineTools which later can be connected into Workflows. CommandLineTools are essentially wrappers for commands that would usually be executed in the command line. CWL uses a special YAML structure to describe those processes.
#!/usr/bin/env cwl-runner
cwlVersion: v1.2class: CommandLineTool
requirements:- class: DockerRequirement  dockerPull: osgeo/gdal:ubuntu-full-3.6.3- class: InlineJavascriptRequirement
inputs:- id: districts_geojson  type: string  default: districts.geojson  inputBinding:    position: 0- id: data_braunschweig  type: Directory  default:    class: Directory    location: ../../data/braunschweig  inputBinding:    position: 1- id: lco  type: string  default: RFC7946=YES  inputBinding:    prefix: -lco
outputs:- id: districts  type: File  outputBinding:    glob: $(inputs.districts_geojson)
baseCommand: ogr2ogr
However it may is tedious to write those files by hand. That is where s4n comes to the rescue. A Command that would normally happen on the command line just needs to be prefixed with s4n tool create. Examples can be found at the documentation.
To create Tools based of the Python scripts in the code Directory a virtual environment needs to be created using
python3 -m venv .venvsource .venv/bin/activatepip install plotly pandas kaleido==0.2.1 matplotlibThe next step is to download election data using a series of API calls for which luckily already a script exists. The script downloads the data from votemanager.kdo.de and writes the csv to stdout.
A tool can be created easily be prefixing the python call. However we also need to escape the > using a backslash for it to properly work
s4n create python code/download_election_data.py --ags 03101000 --election "Bundestagswahl 2025" \> data.csvThe written csv file lacks the header information of which party results correspond to which column. Therefore we use the get_feature_info script and create a tool as follows:
s4n create python code/get_feature_info.py --data data.csvWith this information the election plot can be outputted. The script plot_election does the job and accepts the json file from get_feature_info and the aforementioned csv.
s4n create -c Dockerfile --container-tag pyplot --enable-network python code/plot_election.py --data data.csv --features features.jsonCombining the Tools into a workflow
Section titled “Combining the Tools into a workflow”The three CommandLineTools now will be combined into an automated pipeline. A barebones workflow can be generated by using the create command. This command is optional, as the connect command also triggers creation of a workflow.
s4n create --name demoThe workflow that is being built looks like the graph represented in the following image

First of all a connection between the donwload script and get_feature_info as well as plot_election is created by
s4n connect demo --from download_election_data/data --to get_feature_info/datas4n connect demo --from download_election_data/data --to plot_election/dataTo get the correct values for --from and --to the command s4n tool ls -a can be used.
The plot tool also needs the feature information, so the next step is to combine both tools:
s4n connect demo --from get_feature_info/features --to plot_election/featuresTo use the workflow it needs inputs and outputs. In this demo’s tools there are a lot of inputs, but some have default values. That means only neccesary connections have to be made. For the creation of inputs the --from value neeeds to start with @inputs.
s4n connect demo --from @inputs/election --to download_election_data/elections4n connect demo --from @inputs/ags --to download_election_data/agsAdding outputs follows the same logic, however @outputs is used in --to
s4n connect demo --from plot_election/election --to @outputs/barSaving the workflow is neccessary to have a clean git history for further creating CommandLineTools.
s4n save demoDuring the creation s4n workflow status demo can always be used to view the connection status.
Adding additional steps
Section titled “Adding additional steps”The next tool uses GDAL to convert the shape file in data/braunschweig to a geojson file. The Command one would typically use would be
ogr2ogr districts.geojson data/braunschweig -lco RFC7946=YES# s4n commands4n create ogr2ogr districts.geojson data/braunschweig -lco RFC7946=YESHowever we might not have gdal installed on our machine, so we request s4n to not run the command. Therefore s4n needs to be told what file will be written with -o and for later usage a docker image is specified using -c.
s4n create --name shp2geojson --no-run -o districts.geojson -c osgeo/gdal:ubuntu-full-3.6.3 ogr2ogr districts.geojson data/braunschweig -lco RFC7946=YESThis correct creation of the tool can be tested using
s4n execute local workflows/shp2geojson/shp2geojson.cwlThe outputted file now needs to be committed to move on
git add . && git commit -m "Execution of shp2geojson"In the last step the plot tool needs to be created. In this tool plotly is used to create a choropleth graph based on the outputs of the preceeding steps. The packages installed to the virtual environment are needed here. A Dockerfile to use is already in the repo.
s4n create -c Dockerfile --container-tag pyplot --enable-network python code/plot_map.py --geojson districts.geojson --csv data.csv --feature F3 --on gebiet-nr:BEZNUM --output_name plotAdding the new tools to Workflow
Section titled “Adding the new tools to Workflow”The two new tools will now be added to the workflow.

Knowing that the plot tool needs the geojson, a connection from the geojson output to the corresponding input can be created.
s4n connect demo --from shp2geojson/districts --to plot_map/geojsonAs the plot step also needs the election data, another connection can be created.
s4n connect demo --from download_election_data/data --to plot_map/csvNow we need to wire up the inputs. The input connections for ags, election, featureand shapes will be created as follows:
s4n connect demo --from @inputs/feature --to plot_map/features4n connect demo --from @inputs/shapes --to shp2geojson/data_braunschweigThe last step is to add the output to the workflow. Only the png file is desired.
s4n connect demo --from plot_map/plot --to @outputs/mapThe final workflow needs to be saved.
s4n save demoWorkflow Execution
Section titled “Workflow Execution”We want to clean our workspace by deleting the outputs we created by creating the CommandLineTools. For the execution a parameter file will be created using the s4n execute make-template command.
s4n execute make-template workflows/demo/demo.cwl > inputs.ymlThis needs to be updated using the correct input values:
ags: "03101000"election: Bundestagswahl 2025shapes: class: Directory location: data/braunschweigfeature: F3Execution of the Workflow is done by
s4n execute local workflows/demo/demo.cwl inputs.yml